CSV, CRM, and sample data
What it represents
There are three ways to have data in ax1om, and they are not the same thing.
Sample data is synthetic and provisioned for you. It exists so you can walk the whole product before deciding anything. It is not your CRM and it is labeled that way everywhere it appears.
A CSV is your data with no access required. Export leads or contacts, drop the file in, and train on it.
A CRM connection is the full path. Connect Salesforce or HubSpot and ax1om reads your objects and fields directly.
How it’s calculated
Sample data is already seeded, so scores, models, runs, factors, and performance views all work immediately, on records that are not real.
A CSV upload parses the file, detects column types, and stands the columns up as a data source you can build a score on. There is no CRM authorization step and no admin conversation to have first.
Connecting a CRM runs schema discovery: ax1om pulls your objects, fields, record counts, and how the data is distributed across years, then tiers fields by how populated they are so you can see what is worth training on. Sample data and CSV sources do not count against your plan’s connection limit.
The walk, whichever source you started from
The path from data to a first model is the same for all three. Only the records underneath it differ.
-
Open Scores and see what is already there
Active scores sit at the top. Anything still a draft, paused, or provisioned as sample data sits below them, and sample entries carry a Sample label everywhere they appear so a demo score is never mistaken for a live one.
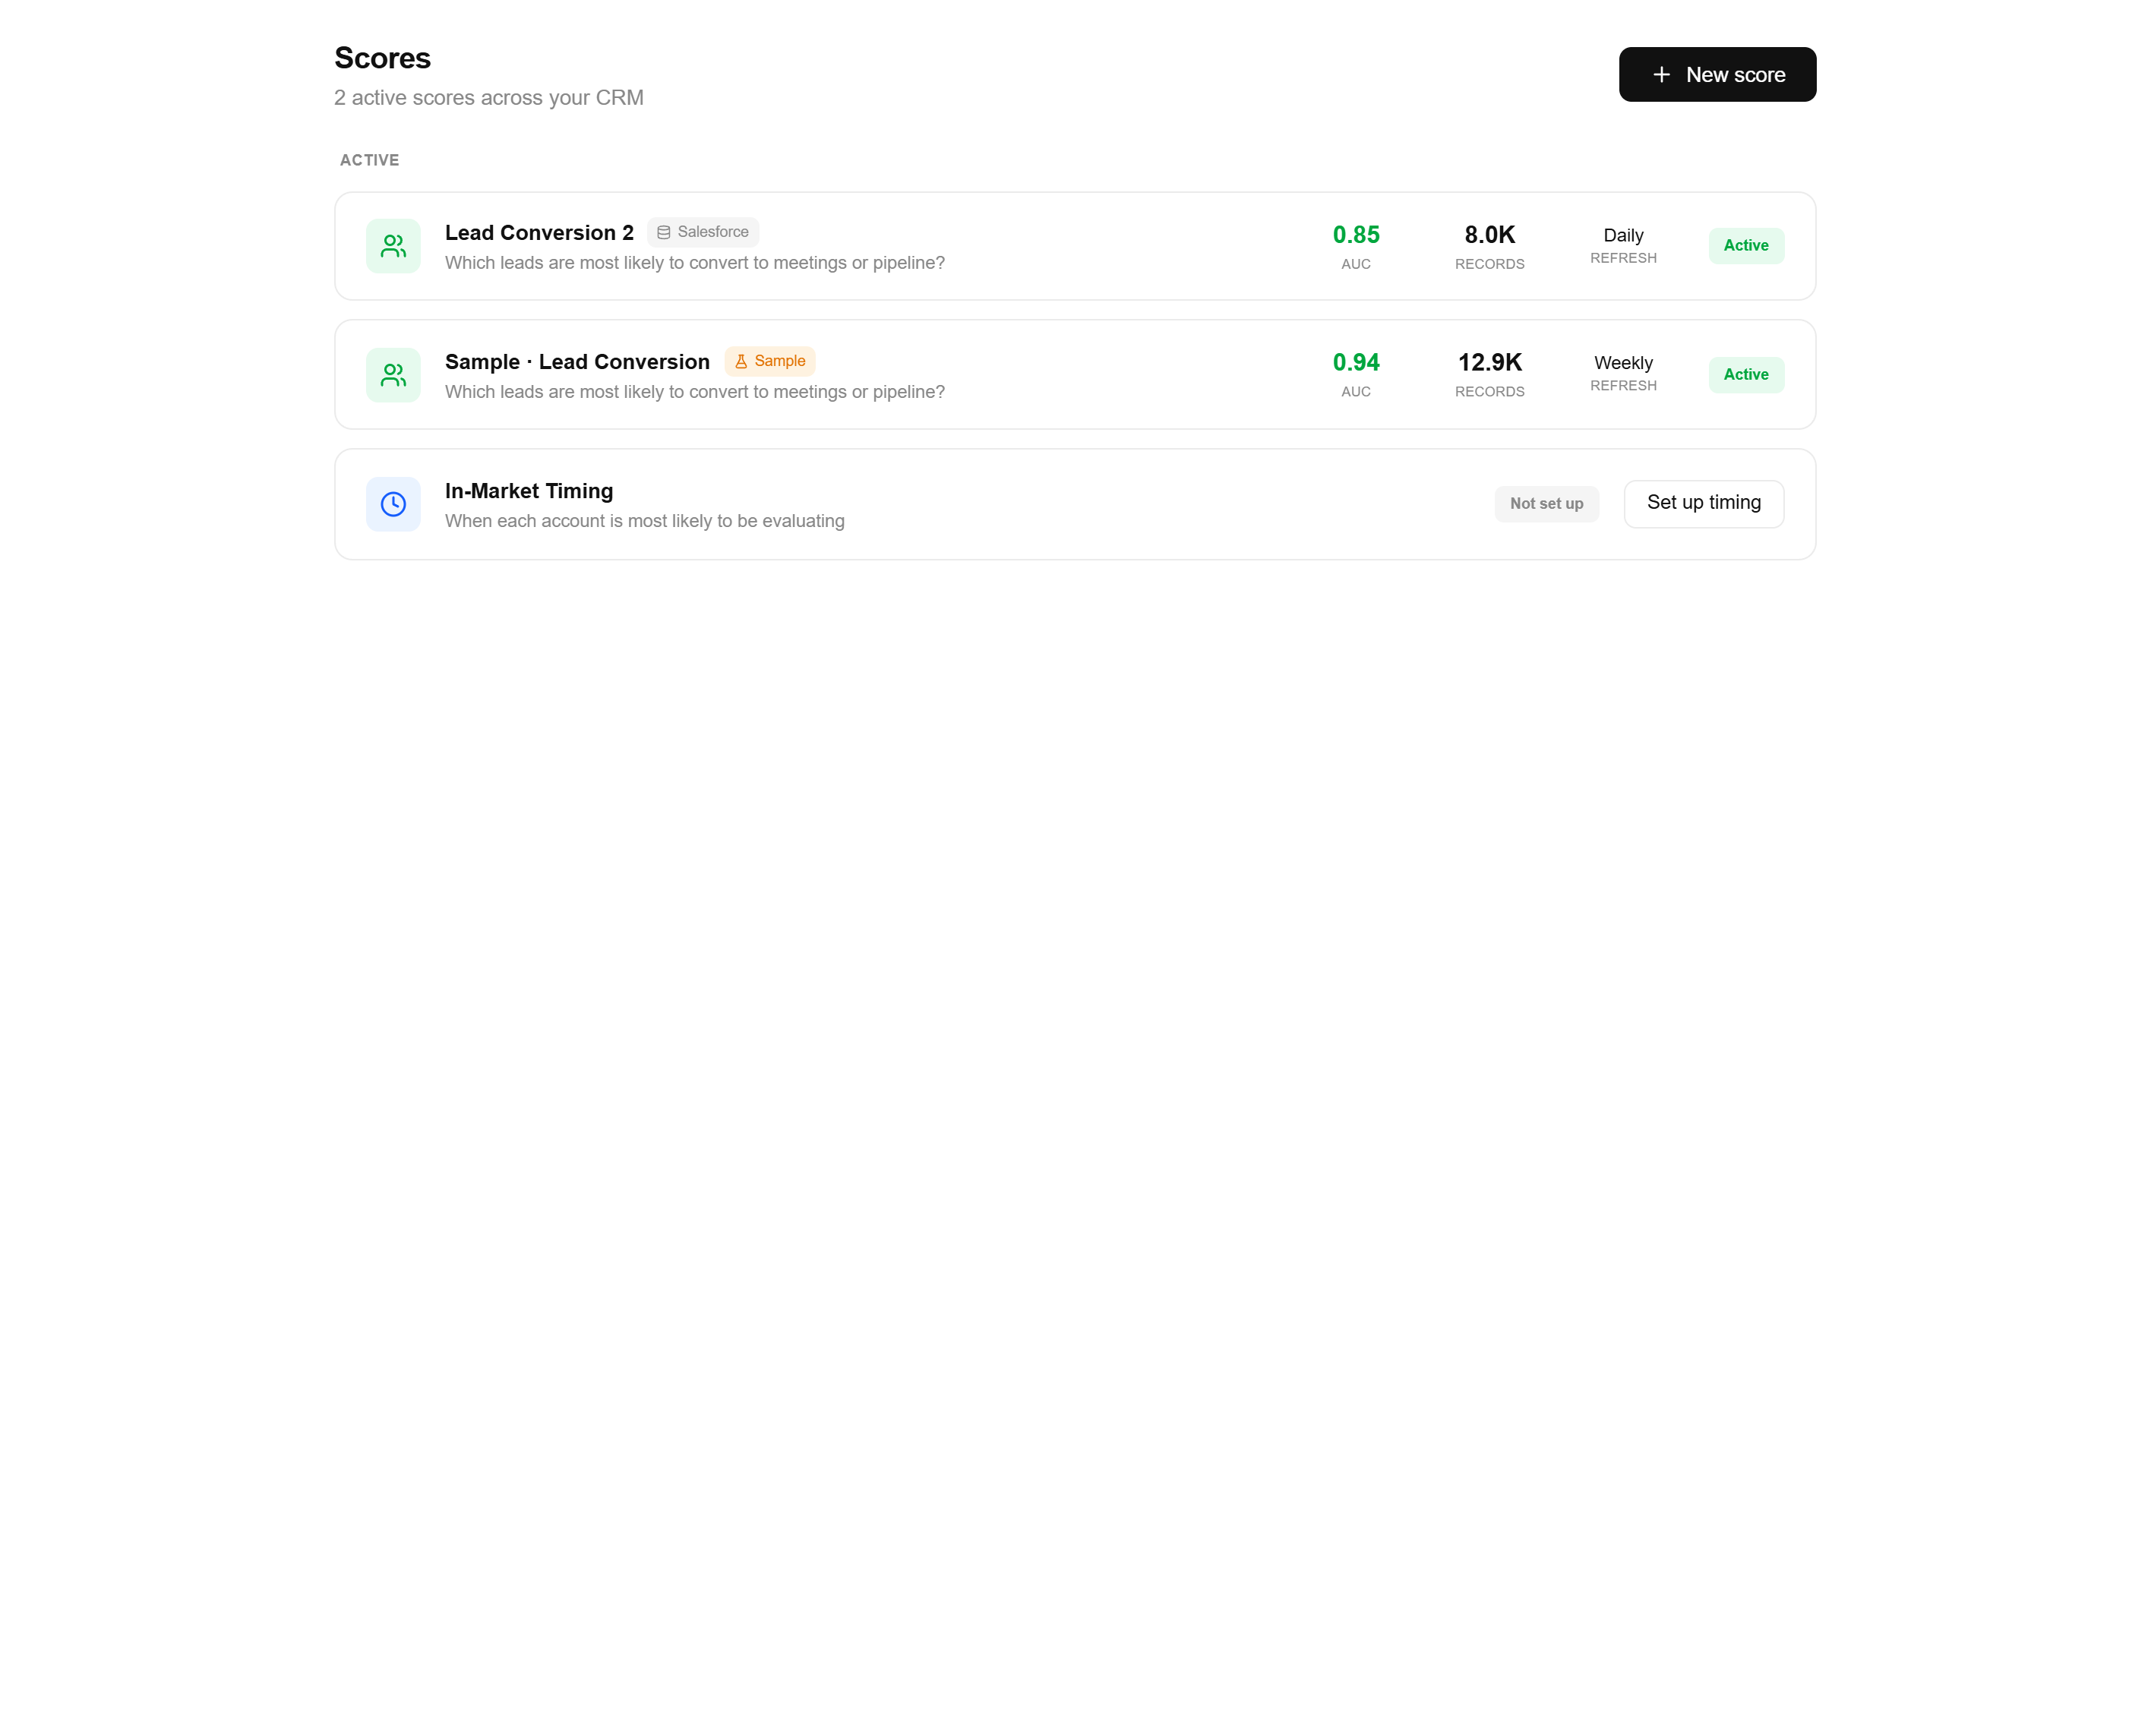
The Scores list · the Sample tag is the sample-data org, not your CRM. -
Create a score by picking what you want to predict
Templates are grouped by what they score: people, accounts, or deals. Each one is a question rather than a configuration, and picking it seeds the entity, the success criteria, and a sensible starting field set. Templates for features that have not shipped are shown but labelled, and there is a start-from-scratch option at the bottom for anything the list does not cover.
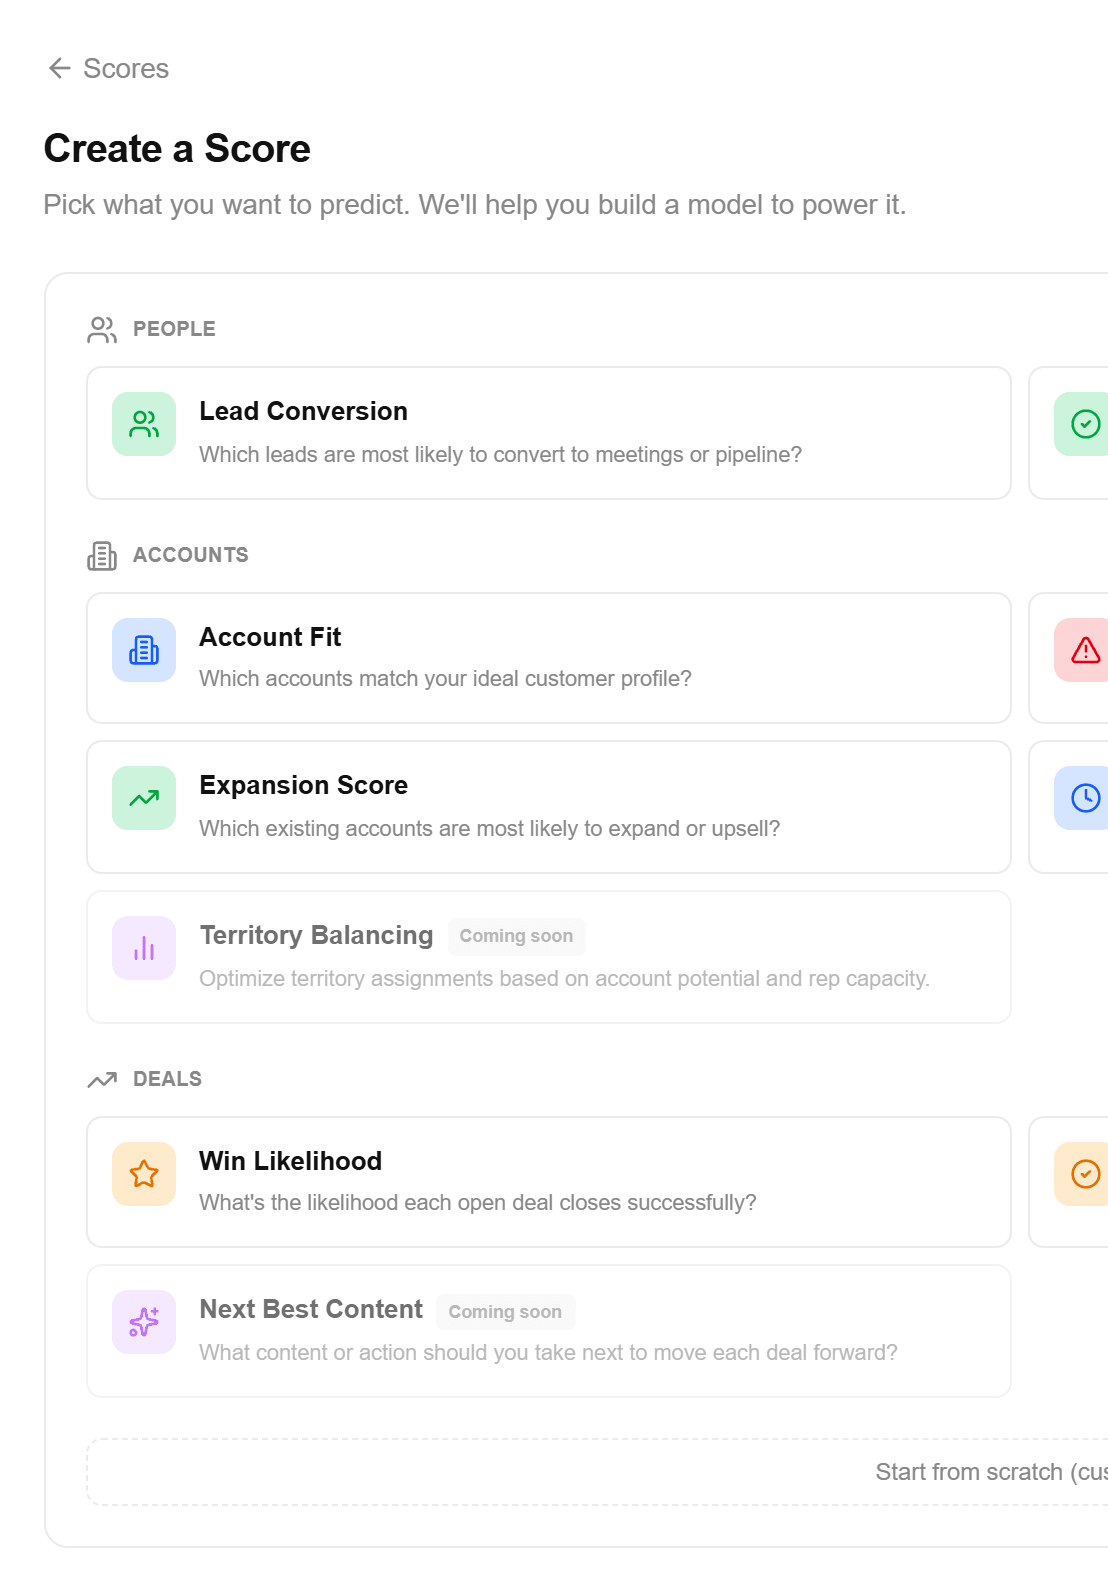
Templates are questions, not settings · the wording under each one is the question the score answers. -
Work the three wizard steps in order
Data, then engagement, then review and train. The first step is where the source you brought actually matters, and it is the step worth slowing down on: everything after it is reading what you chose here.

-
Pick fields from the available list
Fields are grouped by the object they came from, with the count beside each group name and a search box over the whole set. The bar and percentage on each row is how often that field is populated, so an empty column is visible before you spend a training run on it. Suggest fills a starting set for you, and the star marks a field as recommended.
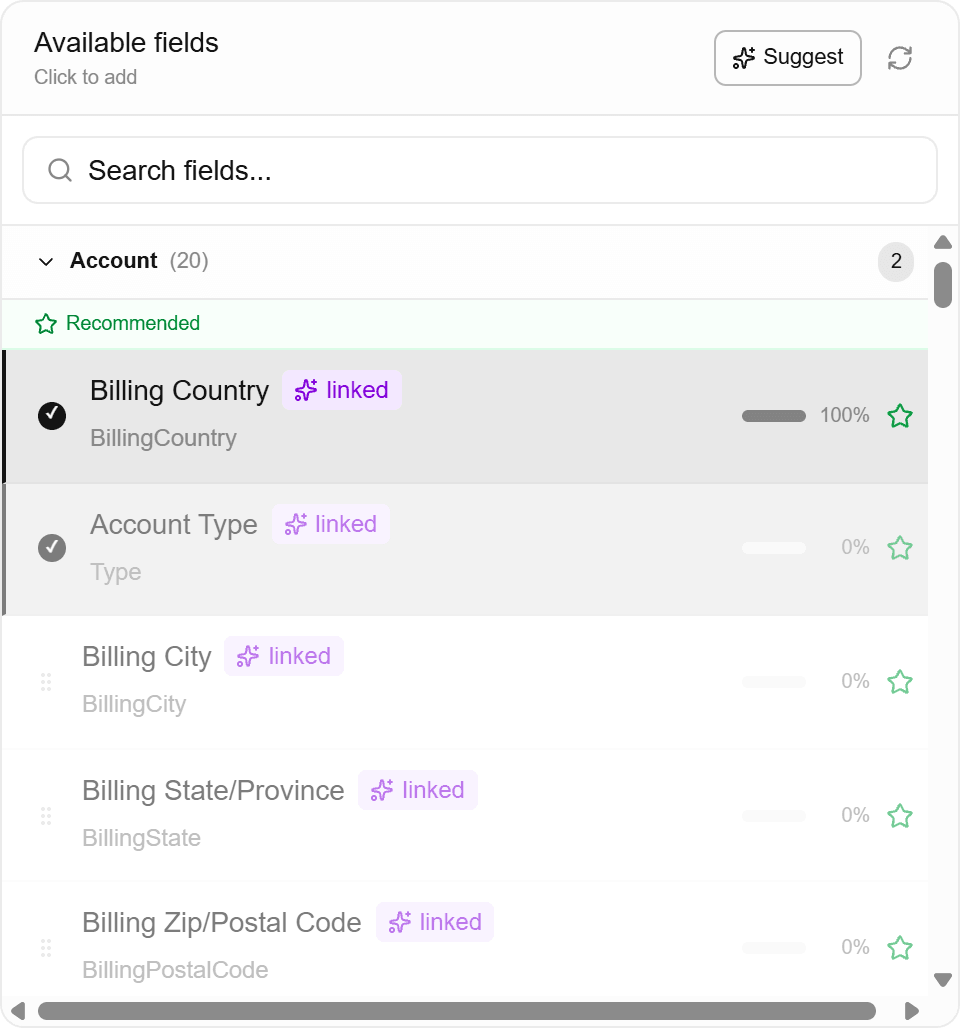
The Available fields panel · the percentage is fill rate, measured on your own records rather than assumed. -
Read the health panel as you go, not afterwards
Every field you add lands here with its type, its fill rate, and a badge for how many distinct values it holds. The footer counts what you have selected against the merged record total. This is the cheapest moment in the whole process to notice that half your selections are empty.
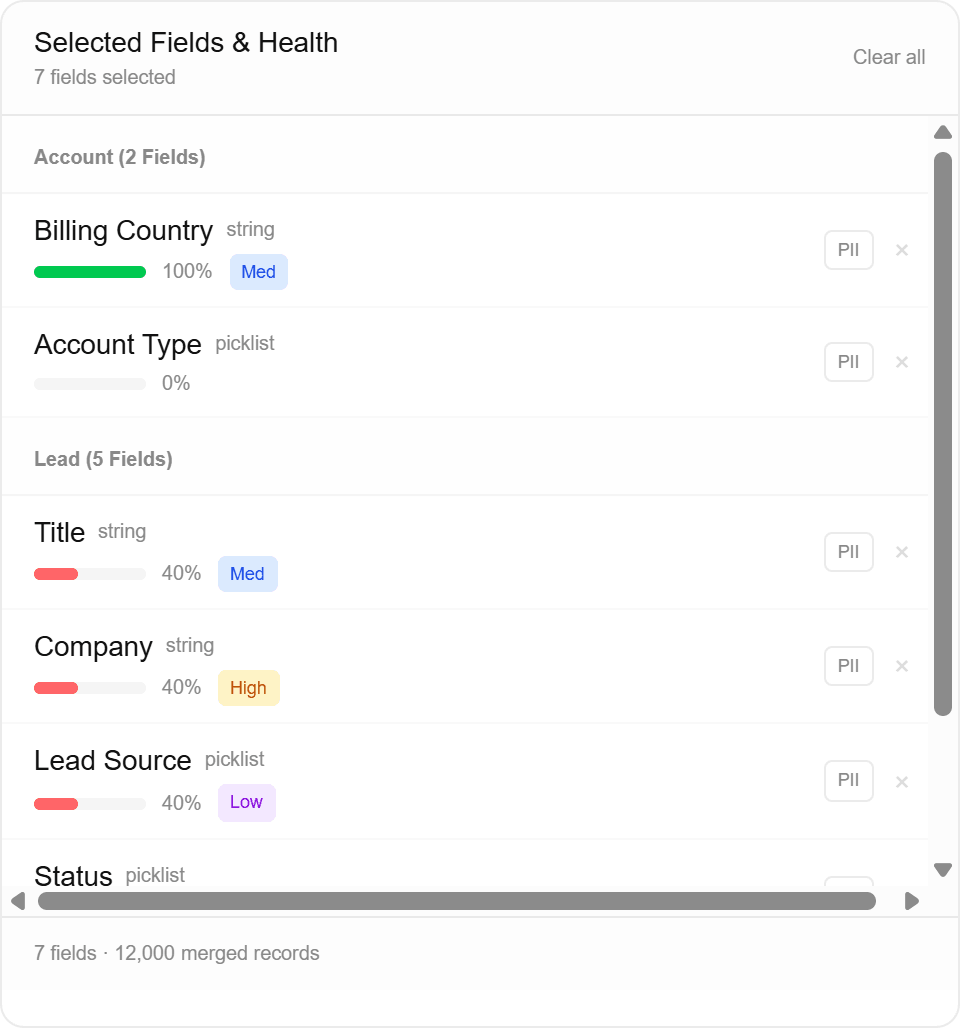
Selected fields and health · fill rate on the left, how many distinct values on the right.
What it means for you
The difference is what happens after the first model. Scheduled refresh needs something to refresh from, and writeback needs somewhere to write. Both of those want a live connection. On sample data you can see how scores behave; you cannot push them anywhere, because there is no CRM behind them. A CSV is a snapshot, so a new week of data means a new upload.
Worked example: you spend an hour on sample data, train a model, and read its AUC, feature analysis, and per-record factors to decide whether the approach holds up. Then you upload a 30,000-row export of last year’s leads and train on your own history · that is where the number starts meaning something about your market. When it does, connect the CRM, set a weekly cadence, point the score at a field, and the whole thing runs without you.
Any of the three is a legitimate place to start. Only the last one is a place to stay.