Where key insights come from
Key insights are the short, readable findings under the KPI cards. They are the first thing most people read, so it is worth knowing exactly where they come from.
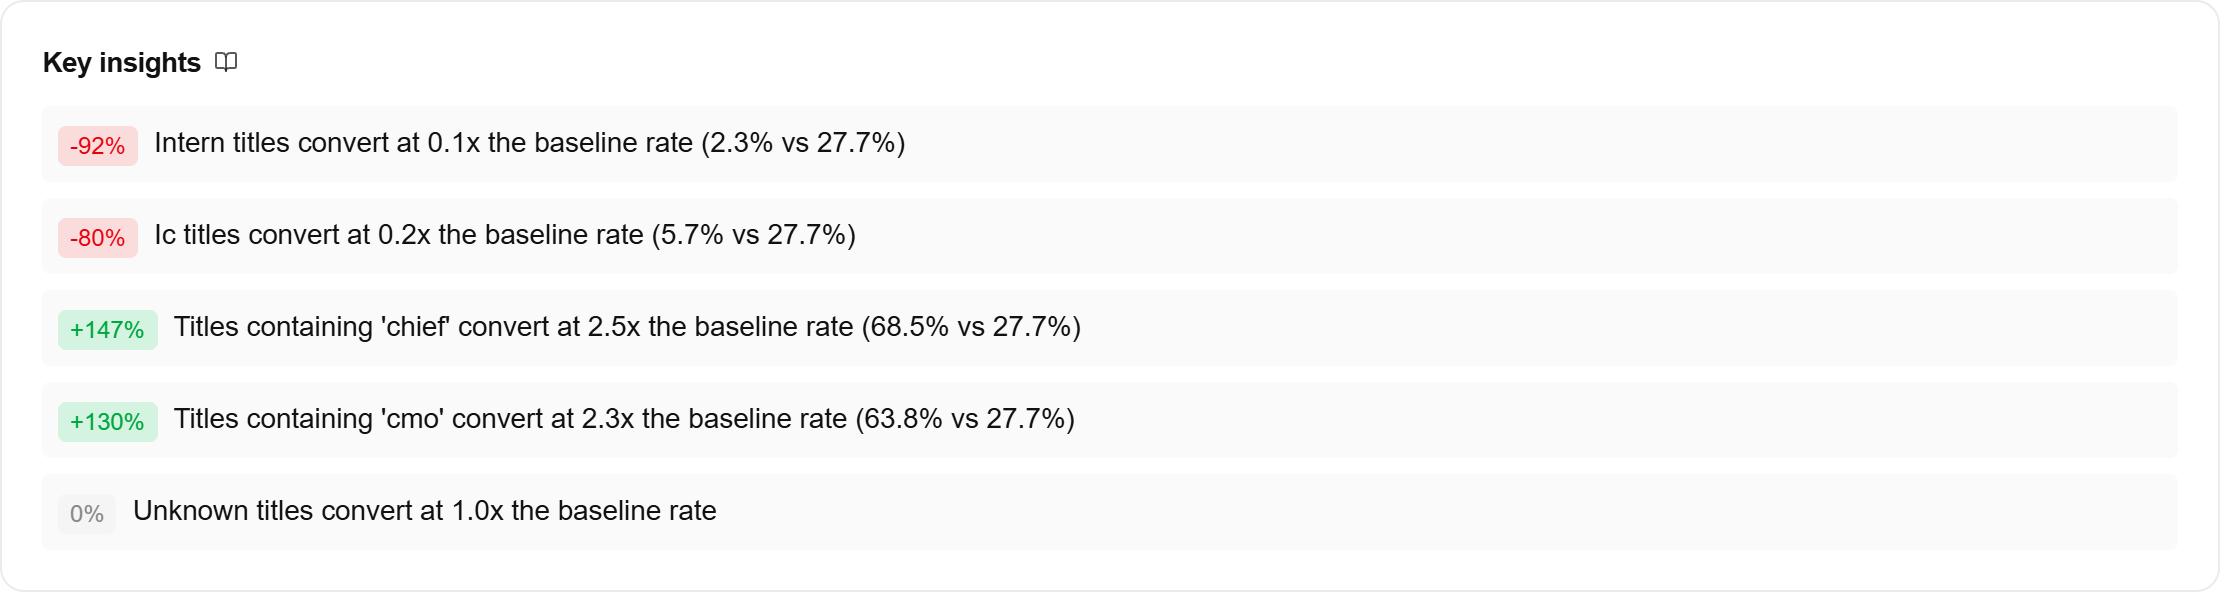
What it represents
Each insight compares one group of records against the baseline. A group is a field value or a value pattern: a lead source, a seniority level, a word appearing in a job title.
The number on the left is the difference from baseline. Plus 220% means that group converted a little over three times as often as the dataset average.
These are observed rates from your own history. They describe what happened, not what caused it, and not what the model concluded.
How it’s calculated
During feature engineering, ax1om counts the records in each group and the conversions among them, computes that group’s conversion rate, and divides it by the baseline conversion rate across the dataset. Findings are ranked by how far they sit from 1.0x in either direction, so a strongly negative signal can rank above a mildly positive one.
Groups with no conversions are written out in words, as did not convert in this sample, rather than forced into a multiplier. A zero is a small-sample observation, not a verdict that the group never converts.
What it means for you
Worked example. An insight reads: records with source Referral convert at 3.2x the baseline rate, 12.8% versus 4.0%. That is a fact about your history. It does not mean referral is worth 3.2x in the model, and it may not appear near the top of the feature table at all.
The two views disagree for a good reason. Insights measure each group in isolation. Feature analysis measures what each field adds on top of everything else the model already knows. If referrals also happen to be larger companies, and company size is already in the model, referral adds less than its standalone rate suggests. Both readings are correct, they answer different questions.
Read the group size before acting. A 4x finding on 30 records is a hypothesis worth testing, not a targeting rule. And resist the causal jump: a group converting more often is a place to look, not proof that pushing more records into that group will convert them.